Topics
Measure your plot
Summary
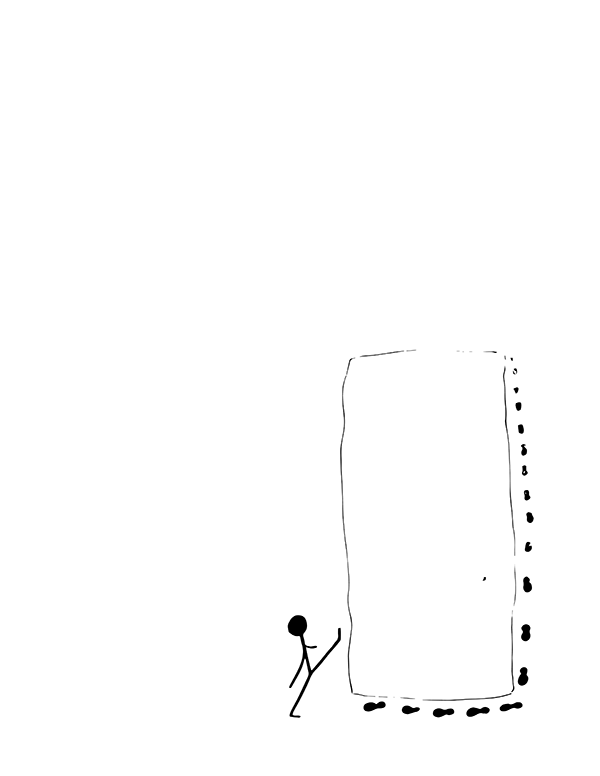
A black line outlines a rectangular plot. In the bottom left corner is a stick figure with one leg stretching 3 feet to represent the pace you can walk to measure your plot with approximation.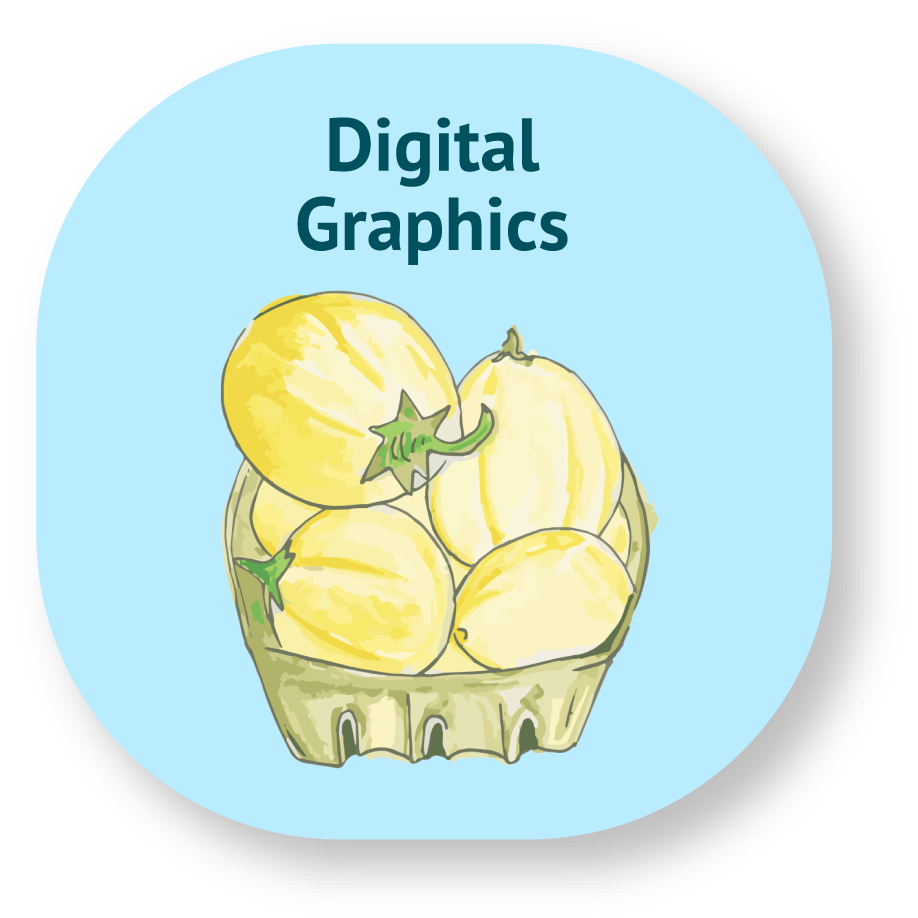
Digital Graphics
Digital graphics are designed using computer software, like Clip Studio Paint, Adobe Photoshop, or Illustrator. Use these to represent concepts or objects in a simplified way. They read more quickly than a photo, and come out clearer when printed. We recommend using graphics when you need to represent something repeatedly throughout your guide, especially to save space on guides.
Click Here to Search this Resource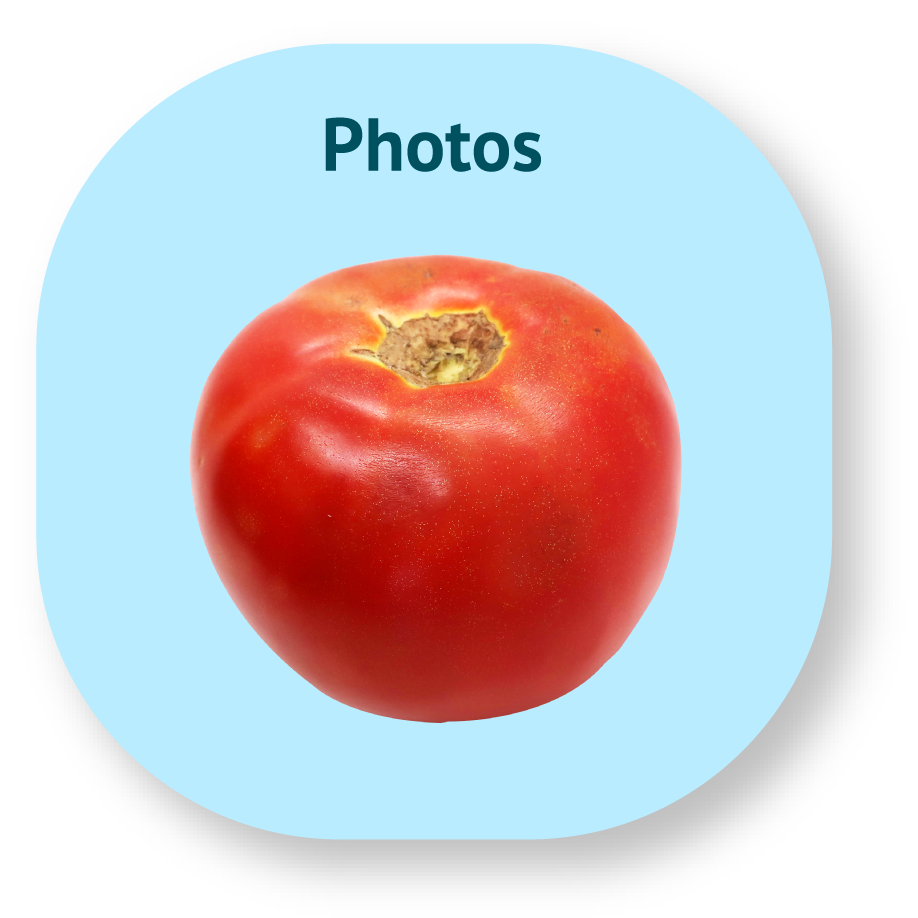
Photos
Photos are images of real life taken with a camera. These are the bulk of our image bank! Use these to show the most realistic version of tools, crops, machines, and more. Good photos are detailed and have a considered composition, typically with a main focal point. Many of our photos are action shots, showing farmers performing the tasks you'd normally see on a farm. Use a photo when you need to identify plants, show specific hands-on skills, or introduce new tools or supplies. Many of our photos were taken by our partner farms through previous grants. Thank you to those who helped make this photo library a reality!
Click Here to Search this Resource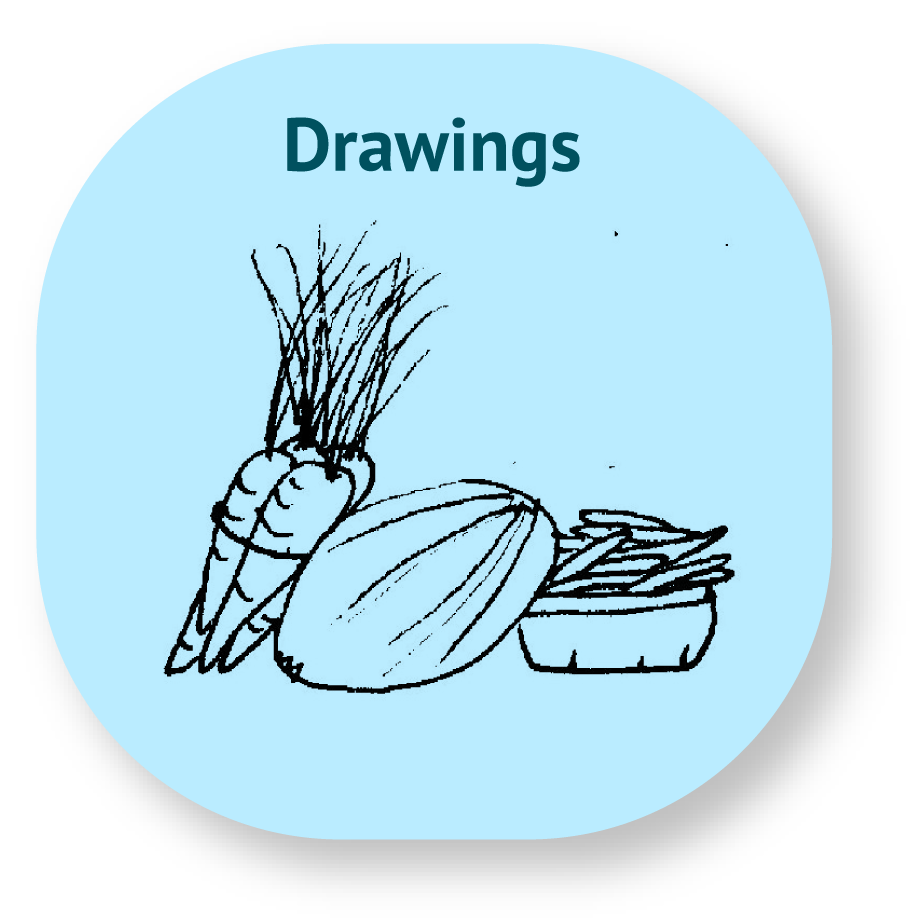
Drawings
Drawings are detailed or simple representations of ideas, objects, or systems. These are especially good for black and white prints, as way to save ink. Drawings are useful to make complicated concepts or systems easier to understand.
Click Here to Search this Resource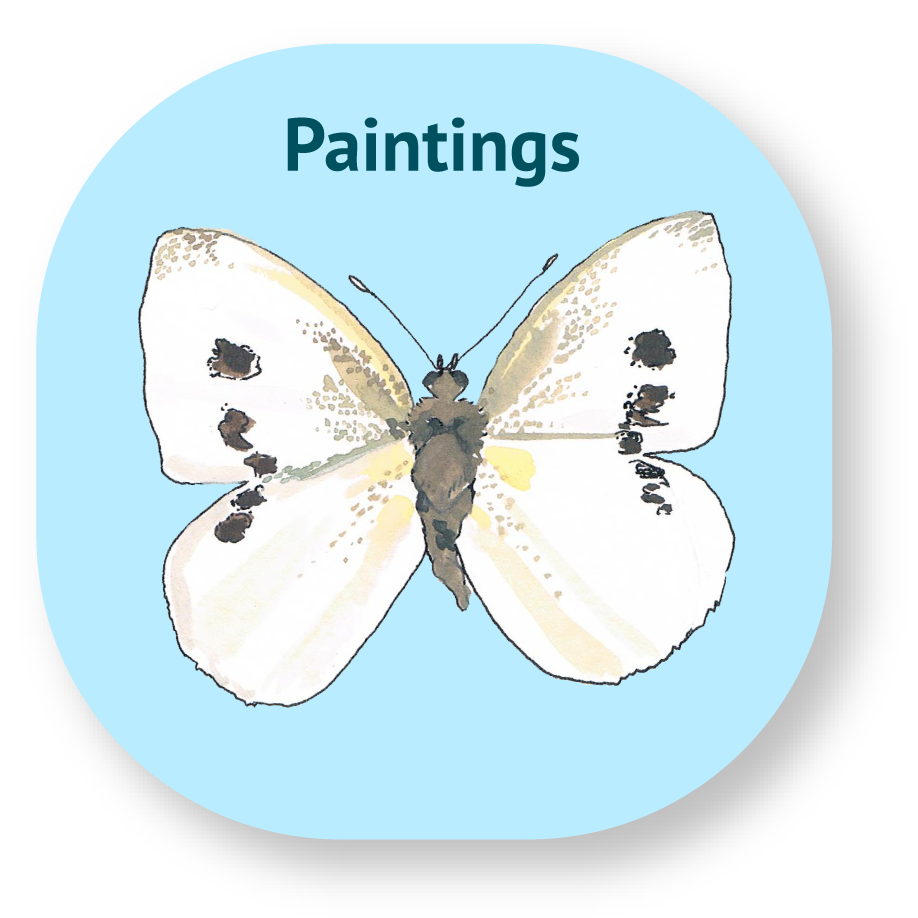
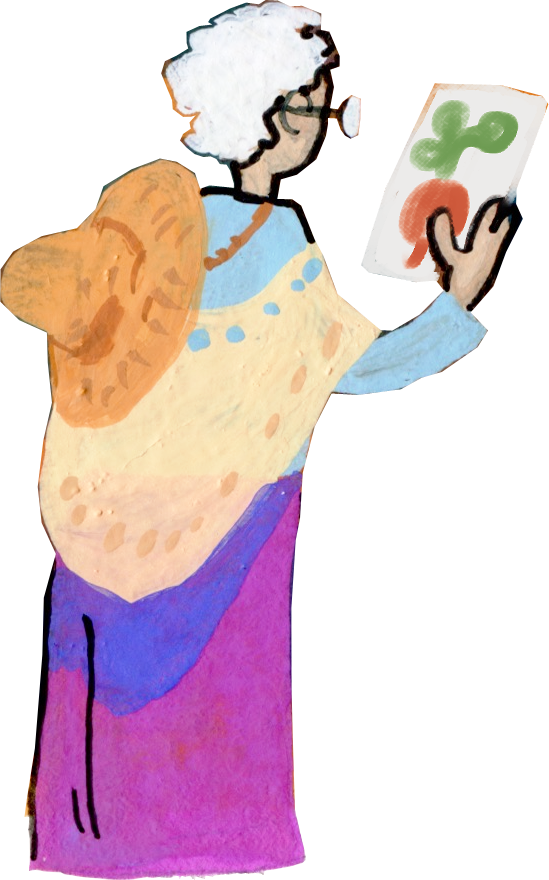
Paintings
Paintings are illustrations created by hand. Use paintings to show things that are difficult to photograph, such as all stages of a pest's life cycle on a single crop at once. Paintings work best when they bend reality, and offer up new perspectives that graphics, photography, and drawing can't achieve. In painting, color shows the differences between living things, while composition emphasizes the main idea. Plus, paintings are just cool. ISED is lucky to have staff members who can render highly detailed and accurate paintings of crops, farming systems, and more. Taylor Fourt and San Miller have created most of these.
Click Here to Search this Resource